


- Mark as New
- Bookmark
- Subscribe
- Mute
- Subscribe to RSS Feed
- Permalink
- Report Inappropriate Content
Hi,
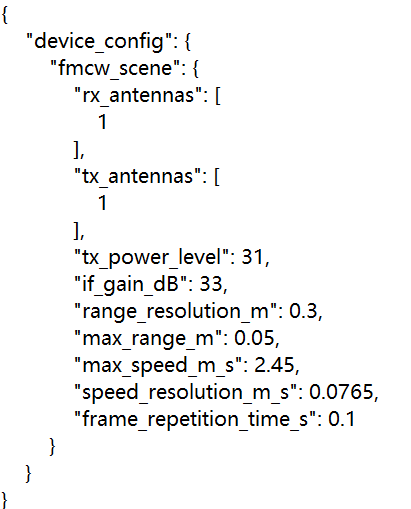
I try to do some short distance measurements, and I have configured the radar similar as Solved: Re: proximal measurement of BGT60TR13C - Infineon Developer Community shows(Fig.1 below) using app_recorder.exe. I need analyze the collection data now. However, as the formula (Fig.2 below) shows, the number of samples per chirp can be less than 1 with the configuration above, I wonder if it is right to configure the radar like this or if I need change some other parameters in fig.1. By the way, I notice that lots of 0 value occurred in the test, I wonder if there were any mistakes?
Solved! Go to Solution.
- Tags:
- BGT60TR13C
- Mark as New
- Bookmark
- Subscribe
- Mute
- Subscribe to RSS Feed
- Permalink
- Report Inappropriate Content
Hi @shibiana ,
"Range resolution means radar can discriminate two objects if one object's distance to the radar is >3cm far away than another object to the radar"- Wrong, Range resolution is the minimum distance between two objects to be detected as two different objects by the radar.
When detecting the object, RCS is one important thing to be taken into consideration, BGT60TR13C is designed for Human RCS. In respiration rate and heartbeat rate measurement, the RCS is quite significant compared to the one you are trying to measure hence making it not possible to measure the depth of the grooves.
Thankyou, Siddharth.
- Mark as New
- Bookmark
- Subscribe
- Mute
- Subscribe to RSS Feed
- Permalink
- Report Inappropriate Content
Hello @shibiana ,
1)When the calculated num_samples_per_chirp goes below config_lower.num_samples_per_chirp (which is 1), it is considered as 1.
2)Furthermore, you can manipulate the range resolution to increase the num_samples_per_chirp.
3)Also, you shouldn't see zeros, the data will be in 0.XXXX format.
Hope this clears your doubts.
Thankyou, Siddharth.
- Mark as New
- Bookmark
- Subscribe
- Mute
- Subscribe to RSS Feed
- Permalink
- Report Inappropriate Content
- Mark as New
- Bookmark
- Subscribe
- Mute
- Subscribe to RSS Feed
- Permalink
- Report Inappropriate Content
By the way, when the distance is a little far than a close distance, the data is not zero.
- Mark as New
- Bookmark
- Subscribe
- Mute
- Subscribe to RSS Feed
- Permalink
- Report Inappropriate Content
Sorry, I have another question. Now, I want to detect the tiny movement of an object close to the radar (The object is around 1cm~3cm to the radar). Because the tiny movement is measured by phase variance, I wonder if it is right to calculate the phase differences among one chirp's samples? However, when the max_range is determined by the close distance between radar and object, and the range_resolution has its limitation, the num_samples_per_chirp now is 1, how can I calculate the phase differences?
- Mark as New
- Bookmark
- Subscribe
- Mute
- Subscribe to RSS Feed
- Permalink
- Report Inappropriate Content
Sorry, I don't get any replies for several days.
- Mark as New
- Bookmark
- Subscribe
- Mute
- Subscribe to RSS Feed
- Permalink
- Report Inappropriate Content
Hi @shibiana
Sorry for the late reply and the inconvenience, missed the notification somehow.
1) Check the data with app_raw_data , raw data in this app is not zero and also responds to object at ~3cm.
2) You can set max_range more then the distance you wanna measure, as it is the maximum range and radar shall react to anything inside it. With this you can also have more samples per chirp.
Thankyou, Siddharth
- Mark as New
- Bookmark
- Subscribe
- Mute
- Subscribe to RSS Feed
- Permalink
- Report Inappropriate Content
Thank you for your reply. I notice that in the static_distance.py, after doing FFT it searches for the peak after a skip of 8(fig.5). When I calculate with this program, I find that there is a peak before the right peak. I wonder why this phenomenon occurs and if it will have an influence on the proximal measurement.
- Mark as New
- Bookmark
- Subscribe
- Mute
- Subscribe to RSS Feed
- Permalink
- Report Inappropriate Content
- Mark as New
- Bookmark
- Subscribe
- Mute
- Subscribe to RSS Feed
- Permalink
- Report Inappropriate Content
Thank you for your rely. I have another question. I use app_raw_data.exe and do some measurements. The configuration is NUM_samples_per_chirp: 32, Num_chirps_per_frame: 64 and Frames: 130. However, the data I collected was 130 rows and 32 columns, I wonder where is the Num_chirps_per_frame(64). I think it isn't right to have such a format of data.
- Mark as New
- Bookmark
- Subscribe
- Mute
- Subscribe to RSS Feed
- Permalink
- Report Inappropriate Content
Hi @shibiana ,
In app_raw_data, all the chirps are summed up into one single vector.
So the data you see will have number of rows=number of frames*number of antennas and number of columns= number of samples.
If you see the image below (number of frames requested=10, number of columns is 32 as the samples per chirp is 32. And, number of row =3 as number of frames =1 and number of antennas=3 (3*1=3).

Hope this makes you clear.
To get data of all the chirps of the frames you can use app_recorder.
Thankyou, Siddharth.
- Mark as New
- Bookmark
- Subscribe
- Mute
- Subscribe to RSS Feed
- Permalink
- Report Inappropriate Content
Thank you for your reply. And do you have any idea about my next question below?
- Mark as New
- Bookmark
- Subscribe
- Mute
- Subscribe to RSS Feed
- Permalink
- Report Inappropriate Content
"all the chirps are summed up into one single vector". I wonder whether it means the average of all chirps of a frame?
- Mark as New
- Bookmark
- Subscribe
- Mute
- Subscribe to RSS Feed
- Permalink
- Report Inappropriate Content
Yes, there are averaged values. You may also go through process_antenna_data function in the code to see the same.
- Mark as New
- Bookmark
- Subscribe
- Mute
- Subscribe to RSS Feed
- Permalink
- Report Inappropriate Content
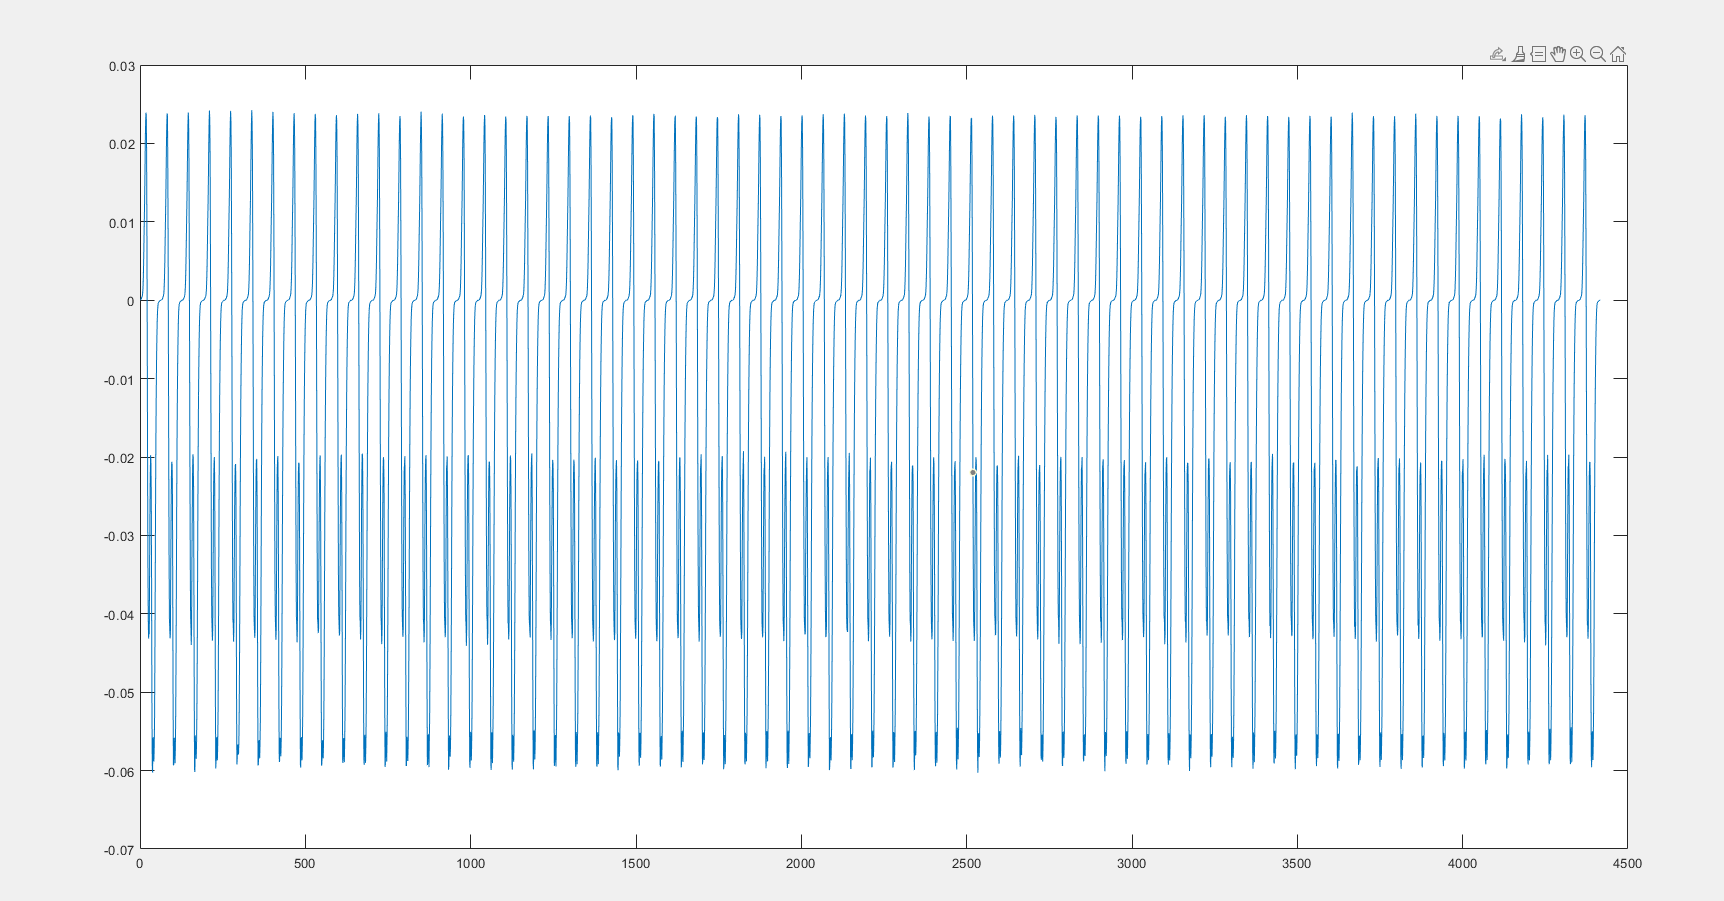
By the way, I am doing a scanning with the radar now. The radar scans in horizontal direction and the plane which is scanned has several grooves with 1mm wide and 1mm deep. I wonder if the radar can detect the grooves with phase differences. I notice that the time-domain signals I get after scanning show changes in the amplitude(fig.6) and when I keep static it is like (fig.7) shows. I wonder if it is suitable to calculate the deep of the grooves with phase differences.
- Mark as New
- Bookmark
- Subscribe
- Mute
- Subscribe to RSS Feed
- Permalink
- Report Inappropriate Content
Hi @shibiana ,
Can you please post the image of the surface you are scanning?
Also, did you scan a completely plain/ smooth surface and see how the signal plot of that looks? Can you also post that?
Thankyou, Siddharth.
- Mark as New
- Bookmark
- Subscribe
- Mute
- Subscribe to RSS Feed
- Permalink
- Report Inappropriate Content
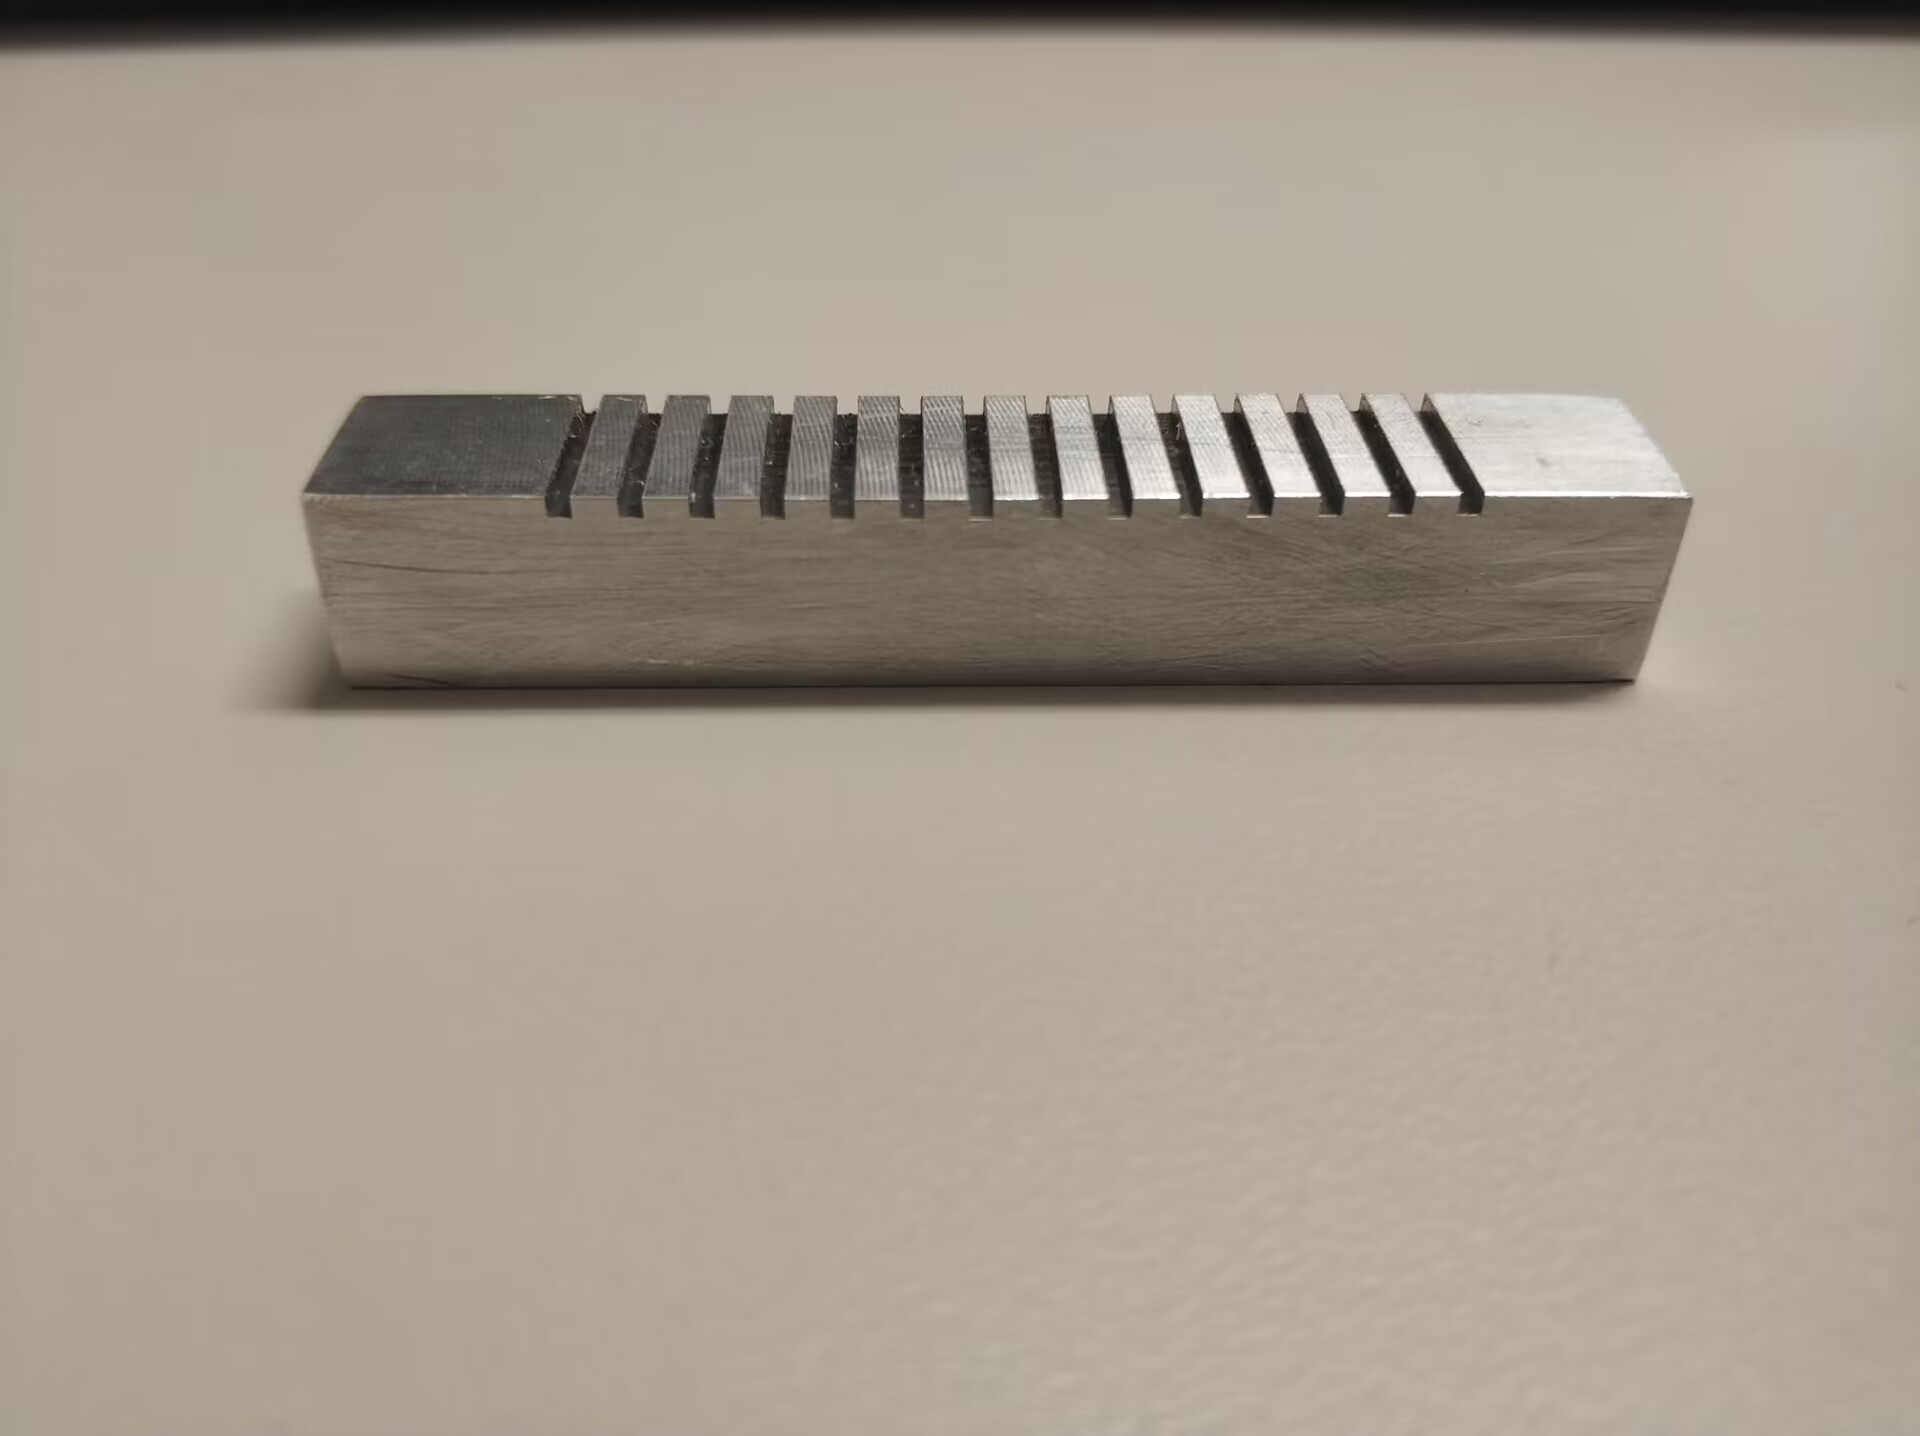
Sure, as you can see these 3 images, the deep and wide are both 1mm, and I try to reconstruct the outline of the surface with phase differences. I fixed the radar to the horizontal stepper motor for horizontal scanning and the surface detected is under the radar.
- Mark as New
- Bookmark
- Subscribe
- Mute
- Subscribe to RSS Feed
- Permalink
- Report Inappropriate Content
It is just like the function of laser scanning or infrared scanning for outline reconstruction. I wonder whether the radar can achieve this aim. Just in case, I want to make sure that there is no problem with my above experimental process and the method of using phase difference to calculate tiny contour difference. Thank you for your patient explain!
- Mark as New
- Bookmark
- Subscribe
- Mute
- Subscribe to RSS Feed
- Permalink
- Report Inappropriate Content
The images are uploaded.
- Mark as New
- Bookmark
- Subscribe
- Mute
- Subscribe to RSS Feed
- Permalink
- Report Inappropriate Content
Hi @shibiana , Can you please upload the time-domain signal plot of scanning a completely flat surface.
Try scanning this part of the object. I want to see this to confirm if the plot you got earlier was noise or due to vibration caused by movement.
.jpg")
Thankyou, Siddharth.
- Mark as New
- Bookmark
- Subscribe
- Mute
- Subscribe to RSS Feed
- Permalink
- Report Inappropriate Content
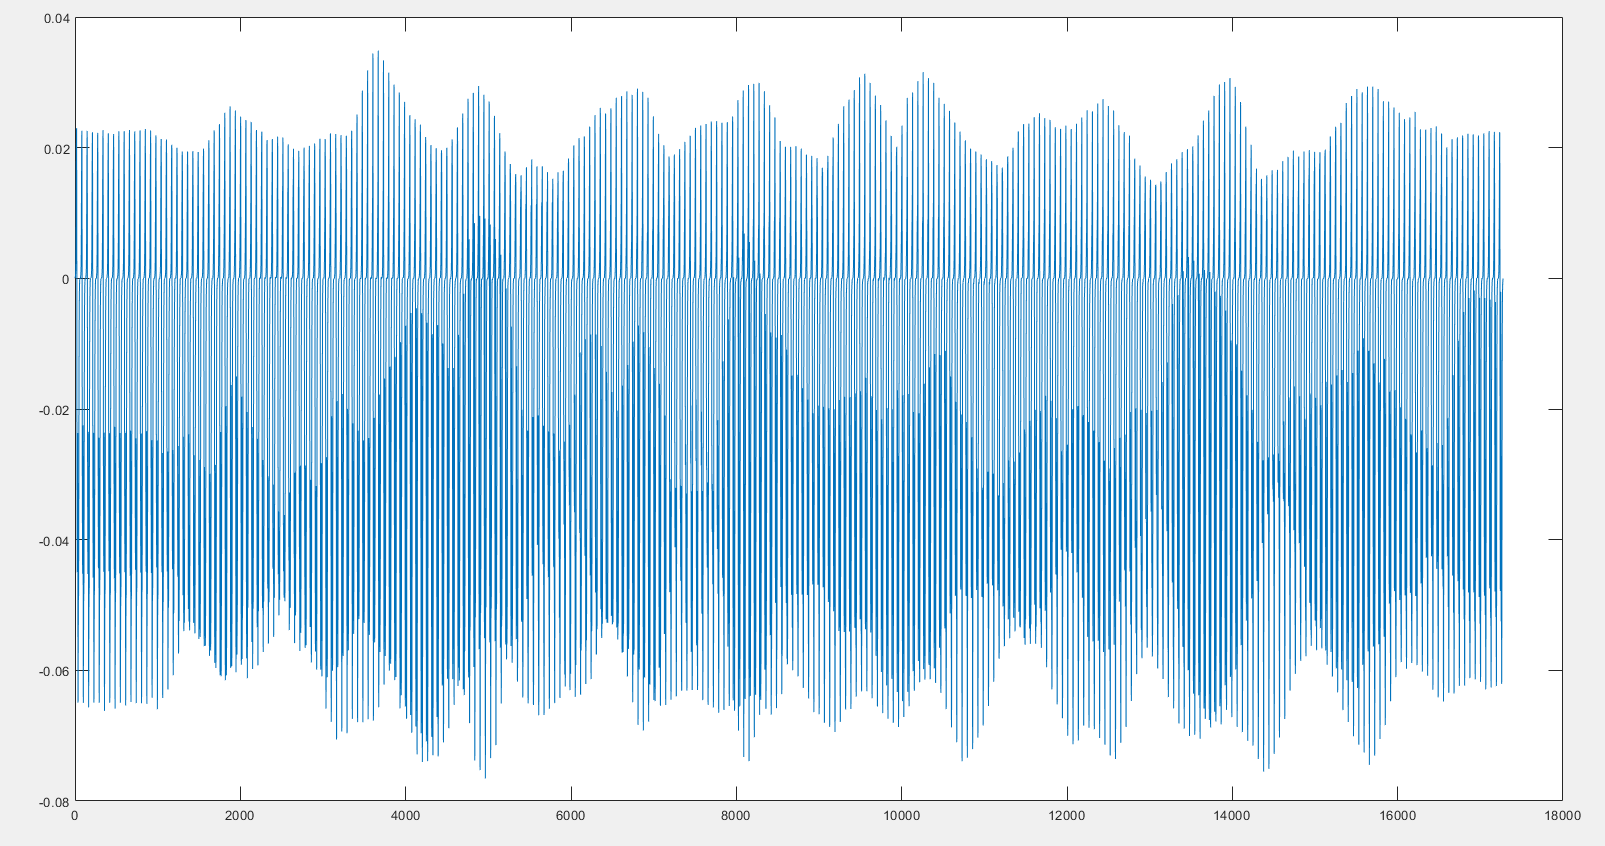
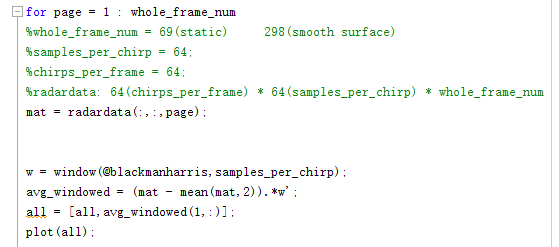
Sure, I upload four figures below. The fig.0 is the program that I use to plot the following three figures. Fig.1 is the result when I keep the radar stay static and detect the smooth surface. Fig.2 is the result that the radar scan the smooth surface. Fig.3 is the result that the radar scan the surface with grooves.
- Mark as New
- Bookmark
- Subscribe
- Mute
- Subscribe to RSS Feed
- Permalink
- Report Inappropriate Content
The figures I uploaded yesterday may have a mistake. Please take the 4 figures I uploaded just now as examples.
- Mark as New
- Bookmark
- Subscribe
- Mute
- Subscribe to RSS Feed
- Permalink
- Report Inappropriate Content
Hello @shibiana,
Unfortunately your experiment of measuring the groove depth with radar will not be work as,
1) BGT60TR13C does not offer range resolution below ~3 cm. Here the profile variations in the y dimension (range) are small then the range resolution
2) This is one single object (which is static) so speed resolution cannot be used to distinguish the surfaces within the grooves.
3) Multiple grooves will lie within the same range bin when the Radar is facing the object. Also the surface variations are very close to each other in the x-dimension which means angle resolution also would not be able to distinguish the different surfaces.
Thankyou, Siddharth.
- Mark as New
- Bookmark
- Subscribe
- Mute
- Subscribe to RSS Feed
- Permalink
- Report Inappropriate Content
Therefore, I wonder if this experiment is quite different from the experiment of Respiratory and heartbeat detection(maybe the motion direction is perpendicular to the radar and scale is about several millimeter) or vibration at small distance? On the other hand, do you mean the phase differences for tiny motion detection can only be used on an object that is not static?
- Mark as New
- Bookmark
- Subscribe
- Mute
- Subscribe to RSS Feed
- Permalink
- Report Inappropriate Content
Yes, in vital signs, the direction of motion is perpendicular and mainly the Radar cross section (RCS) is much higher.
- Mark as New
- Bookmark
- Subscribe
- Mute
- Subscribe to RSS Feed
- Permalink
- Report Inappropriate Content
By the way, Range resolution means radar can discriminate two objects if one object's distance to the radar is >3cm far away than another object to the radar. So I am doubt about (1) the profile variations in the y dimension's meaning. Then, (3)Multiple grooves will lie within the same range bin: Because the respiratory and heartbeat detection experiment also means the human body at a certain range bin and the respiratory and heartbeat is at a tiny scale in the same range bin, then phase differences in this range bin are obtained for the detection. Thus, do you mean the principles are different from the surface detection?
- Mark as New
- Bookmark
- Subscribe
- Mute
- Subscribe to RSS Feed
- Permalink
- Report Inappropriate Content
Hi @shibiana ,
"Range resolution means radar can discriminate two objects if one object's distance to the radar is >3cm far away than another object to the radar"- Wrong, Range resolution is the minimum distance between two objects to be detected as two different objects by the radar.
When detecting the object, RCS is one important thing to be taken into consideration, BGT60TR13C is designed for Human RCS. In respiration rate and heartbeat rate measurement, the RCS is quite significant compared to the one you are trying to measure hence making it not possible to measure the depth of the grooves.
Thankyou, Siddharth.
- Mark as New
- Bookmark
- Subscribe
- Mute
- Subscribe to RSS Feed
- Permalink
- Report Inappropriate Content
Thank you for your answers.