Not applicable
Aug 21, 2014
06:34 AM
- Mark as New
- Bookmark
- Subscribe
- Mute
- Subscribe to RSS Feed
- Permalink
- Report Inappropriate Content
Aug 21, 2014
06:34 AM
Hi All,
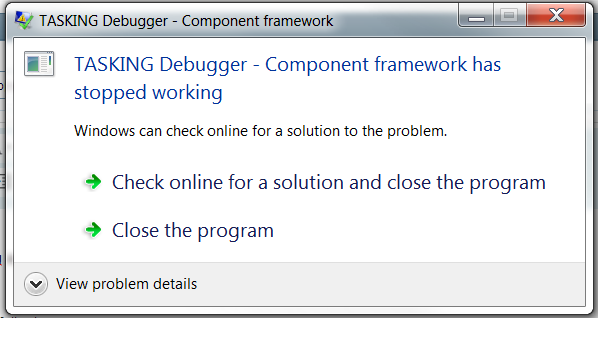
Many times a day I get the following dialog appear in the Tasking debugger...

The dialog problem details field listed the following...
It seems to occur regularly when break points are encountered or configured.
Any suggestions would be greatly appreciated as I am losing my sense of humour 😉
Best regards
Aaron
Many times a day I get the following dialog appear in the Tasking debugger...

The dialog problem details field listed the following...
Problem signature:
Problem Event Name: APPCRASH
Application Name: taskingdebugger.exe
Application Version: 1.29.0.0
Application Timestamp: 52f0c42a
Fault Module Name: libcifcarm_1.dll
Fault Module Version: 1.91.0.0
Fault Module Timestamp: 52f0c4c7
Exception Code: c0000005
Exception Offset: 0003e08d
OS Version: 6.1.7601.2.1.0.256.48
Locale ID: 2057
Additional Information 1: 0a9e
Additional Information 2: 0a9e372d3b4ad19135b953a78882e789
Additional Information 3: 0a9e
Additional Information 4: 0a9e372d3b4ad19135b953a78882e789
Read our privacy statement online:
http://go.microsoft.com/fwlink/?linkid=104288&clcid=0x0409
If the online privacy statement is not available, please read our privacy statement offline:
C:\Windows\system32\en-US\erofflps.txt
It seems to occur regularly when break points are encountered or configured.
Any suggestions would be greatly appreciated as I am losing my sense of humour 😉
Best regards
Aaron
- Tags:
- IFX
3 Replies
Not applicable
Aug 24, 2014
08:13 PM
- Mark as New
- Bookmark
- Subscribe
- Mute
- Subscribe to RSS Feed
- Permalink
- Report Inappropriate Content
Aug 24, 2014
08:13 PM
Hi Aaron,
Do you think it is due to too many break points defined in the code? Why not try to:
1) Delete the old debug launch configuration and reconfigure the debug
2) Remove all breakpoints (including the breakpoints in non-active projects)
Sorry, I don't have this problem. Just some thoughts…
BR,
Zain
Do you think it is due to too many break points defined in the code? Why not try to:
1) Delete the old debug launch configuration and reconfigure the debug
2) Remove all breakpoints (including the breakpoints in non-active projects)
Sorry, I don't have this problem. Just some thoughts…
BR,
Zain
Not applicable
Aug 26, 2014
12:21 AM
- Mark as New
- Bookmark
- Subscribe
- Mute
- Subscribe to RSS Feed
- Permalink
- Report Inappropriate Content
Aug 26, 2014
12:21 AM
Thanks Zain, I'll try your suggestions.
BR
Aaron
BR
Aaron
Attachments are accessible only for community members.
Not applicable
Aug 29, 2014
02:54 AM
- Mark as New
- Bookmark
- Subscribe
- Mute
- Subscribe to RSS Feed
- Permalink
- Report Inappropriate Content
Aug 29, 2014
02:54 AM