Not applicable
May 12, 2015
12:47 AM
- Mark as New
- Bookmark
- Subscribe
- Mute
- Subscribe to RSS Feed
- Permalink
- Report Inappropriate Content
May 12, 2015
12:47 AM
Hello
Currently working on a project using an XMC4500F100F1024 - over the last few days the debugger (Tasker) has appeared to have developed some strange issues. Has anyone experienced similar before? Do Infineon have any suggestions as to where the route cause to these problems may lie.
What I am experiencing is detailed below:
Failure to connect to target hardware via Segger JLink
When launching the debugger the error "Exception Occurred During Launch - Error Creating Session" is displayed. The details of this error are "The debug instrument IO could not be initialized - The GDI debug instrument provided the following error message, An error occurred while connecting to the target. The exact cause is unknown, but possibly the J-Link is not connected to the target properly"
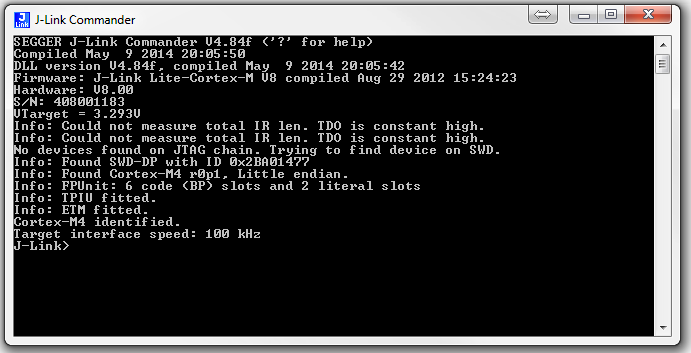
I have seen from previous posts that using the Seggar J-Link Commander gives indication of the connection state between the target hardware and the JLink. If I run this I an returned the following:

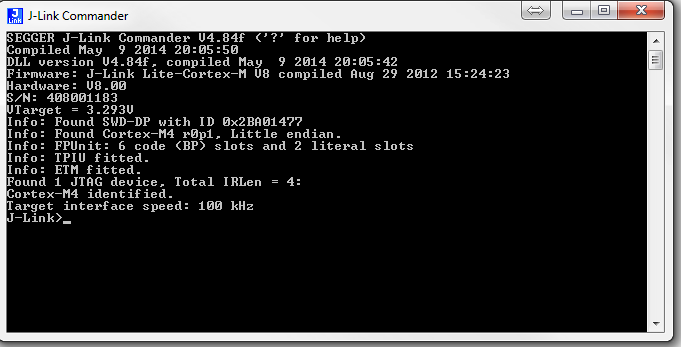
If I run J-Link commander a second time (without any change in target hardware or setup) it returns the following:

After this the Dave debugger will launch correctly - whilst this does not stop me there is definitely an issue with my Dave/JLink setup which is causing this (this is repeatable between my bespoke target hardware and the Infineon HEX Kit.
Breakpoints Not Working in some cases
When I have managed to get the debugger launched I see further, more critical issues, it seems that breakpoints will not operate in all areas of my code. An example would be a GPIO pin I am toggling every 500mS to switch an LED to show that the firmware is operating - the DAVE IDE is allowing a break point to be inserted but when it the code is passing though the breakpoint (LED is flashing) the debugger is not stopping and presenting the disassembly. Whilst in this example it is not an issue other more complex areas of my code which require debug appear to be behaving in a similar way.
It is my understanding that the hardware (XMC4500F100F1024) allows six hardware breakpoints? Is it possible that some form of corruption in the flash memory which stores these breakpoints could be causing my issue?
This issue has already cost me several days in my development (trying to understand if I am looking at a code issue or a debugger issue!). Is there any documentation for the DAVE debugger out there? It is very difficult to develop using a platform which you do not have confidence in.
The versions ect. I am running are:
Dave Version 3.1.10 Buld 2014-05-23
Tasking Debugger for DAVE3 v1.44.1.3
Any pointers/hints or ideas are welcome - starting to run out of ideas of what to attempt to resolve this issue.....!
Infineon - please could you reply with urgency, this is holding up my current project!
Thanks
David
Currently working on a project using an XMC4500F100F1024 - over the last few days the debugger (Tasker) has appeared to have developed some strange issues. Has anyone experienced similar before? Do Infineon have any suggestions as to where the route cause to these problems may lie.
What I am experiencing is detailed below:
Failure to connect to target hardware via Segger JLink
When launching the debugger the error "Exception Occurred During Launch - Error Creating Session" is displayed. The details of this error are "The debug instrument IO could not be initialized - The GDI debug instrument provided the following error message, An error occurred while connecting to the target. The exact cause is unknown, but possibly the J-Link is not connected to the target properly"
I have seen from previous posts that using the Seggar J-Link Commander gives indication of the connection state between the target hardware and the JLink. If I run this I an returned the following:

If I run J-Link commander a second time (without any change in target hardware or setup) it returns the following:

After this the Dave debugger will launch correctly - whilst this does not stop me there is definitely an issue with my Dave/JLink setup which is causing this (this is repeatable between my bespoke target hardware and the Infineon HEX Kit.
Breakpoints Not Working in some cases
When I have managed to get the debugger launched I see further, more critical issues, it seems that breakpoints will not operate in all areas of my code. An example would be a GPIO pin I am toggling every 500mS to switch an LED to show that the firmware is operating - the DAVE IDE is allowing a break point to be inserted but when it the code is passing though the breakpoint (LED is flashing) the debugger is not stopping and presenting the disassembly. Whilst in this example it is not an issue other more complex areas of my code which require debug appear to be behaving in a similar way.
It is my understanding that the hardware (XMC4500F100F1024) allows six hardware breakpoints? Is it possible that some form of corruption in the flash memory which stores these breakpoints could be causing my issue?
This issue has already cost me several days in my development (trying to understand if I am looking at a code issue or a debugger issue!). Is there any documentation for the DAVE debugger out there? It is very difficult to develop using a platform which you do not have confidence in.
The versions ect. I am running are:
Dave Version 3.1.10 Buld 2014-05-23
Tasking Debugger for DAVE3 v1.44.1.3
Any pointers/hints or ideas are welcome - starting to run out of ideas of what to attempt to resolve this issue.....!
Infineon - please could you reply with urgency, this is holding up my current project!
Thanks
David
Labels
- Tags:
- IFX
4 Replies
Not applicable
May 12, 2015
02:23 AM
- Mark as New
- Bookmark
- Subscribe
- Mute
- Subscribe to RSS Feed
- Permalink
- Report Inappropriate Content
May 12, 2015
02:23 AM
Not applicable
May 12, 2015
02:34 AM
- Mark as New
- Bookmark
- Subscribe
- Mute
- Subscribe to RSS Feed
- Permalink
- Report Inappropriate Content
May 12, 2015
02:34 AM
Zain
Thanks for the reply!
Do you know of an easy way to move DaveV3 projects into DaveV4?
David
Thanks for the reply!
Do you know of an easy way to move DaveV3 projects into DaveV4?
David
Not applicable
May 12, 2015
10:54 PM
- Mark as New
- Bookmark
- Subscribe
- Mute
- Subscribe to RSS Feed
- Permalink
- Report Inappropriate Content
May 12, 2015
10:54 PM
Not applicable
May 15, 2015
05:17 AM
- Mark as New
- Bookmark
- Subscribe
- Mute
- Subscribe to RSS Feed
- Permalink
- Report Inappropriate Content
May 15, 2015
05:17 AM
Zain
Thanks for the help - managed to create a fresh Dave3 project and copy the "Dave/Model" folder accross to retain my app configuration. Then manually re-adding all my code solved the issue.
I assume some form of file corruption or setting within my Dave3 project was the cause.
Dave
Thanks for the help - managed to create a fresh Dave3 project and copy the "Dave/Model" folder accross to retain my app configuration. Then manually re-adding all my code solved the issue.
I assume some form of file corruption or setting within my Dave3 project was the cause.
Dave